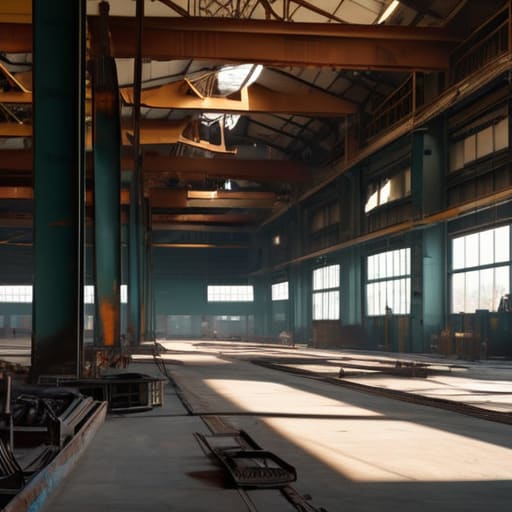
I remember standing on a humid factory floor in Vietnam three years ago, watching a production manager walk me through a “state-of-the-art” quality manual that was nothing more than a laminated prop. The binder was pristine, the office was air-conditioned, and the sales pitch was flawless, but if you looked closer at the actual assembly line, the machines were coughing up dust and the operators were using improvised tools to fix basic defects. Most people think you need expensive third-party consultants or complex data modeling to understand how to spot a struggling factory, but they’re looking at the wrong spreadsheets. The truth is usually much louder, messier, and far more obvious if you know which red flags to actually watch for.
In this post, I’m stripping away the corporate jargon to give you the ground-level reality of what a failing supplier actually looks like before they miss your shipment. I won’t give you a checklist of theoretical risks; instead, I’m going to show you how to read the unspoken signals—from the way maintenance logs are “lost” to the tell-tale signs of sudden, unexplained turnover on the floor. My goal is to help you see the cracks in the foundation long before they become a line item in your rework budget.
Table of Contents
- Decoding Production Throughput Decline and Hidden Equipment Downtime Indica
- Why High Workforce Turnover Rates Predict Your Next Quality Control Failure
- The Subtle Signals: 5 Indicators That a Factory is Losing Its Grip
- The Hard Truths: What Your Audit Data Is Actually Telling You
- The Cost of Ignoring the Warning Signs
Decoding Production Throughput Decline and Hidden Equipment Downtime Indica
When you’re on a factory floor, don’t listen to the plant manager’s promises about “optimizing processes”; look at the machines. A subtle production throughput decline rarely happens overnight; it’s a slow bleed. You’ll see it in the way the rhythm of the line stutters, or how a machine that used to hum now sounds like it’s fighting itself. If you see piles of semi-finished goods sitting idle between stations, that isn’t “buffer stock”—it’s a symptom of bottlenecking caused by aging assets.
I’ve learned to watch for the specific equipment downtime indicators that management tries to gloss over during a scheduled audit. If the floor is cluttered with “temporary” repair patches or if the technicians are constantly hovering around a single piece of critical machinery, they aren’t performing preventative maintenance; they are firefighting. When a supplier starts citing “unforeseen technical issues” to explain away a two-week slip in a lead time, they aren’t having bad luck. They are struggling with unplanned maintenance costs that have finally outpaced their ability to keep the line moving.
Why High Workforce Turnover Rates Predict Your Next Quality Control Failure

When I walk a factory floor, I don’t just look at the machines; I look at the faces. If you see a revolving door of new operators in the assembly area, you aren’t just looking at a HR headache—you are looking at a ticking time bomb for your next shipment. High workforce turnover rates are the most reliable leading indicator of quality control failures I’ve ever encountered. Experience has taught me that tribal knowledge—the unwritten understanding of how a specific machine “feels” when it’s running slightly off-spec—doesn’t live in a manual. It lives in the hands of the people who have been there for five years. When those people leave, that knowledge walks out the door with them.
In a struggling facility, the new hires are often rushed through training just to keep the lines moving. They haven’t developed the muscle memory required to spot a subtle deviation before it becomes a batch of scrap. You might see steady production numbers on their weekly report, but don’t be fooled. That stability is an illusion masking a massive erosion of manufacturing operational efficiency. By the time you see the defect rate spike in your inspection report, the damage is already done, and you’re left paying for the rework while your lead times slip.
The Subtle Signals: 5 Indicators That a Factory is Losing Its Grip
- Watch the “Cleanliness-to-Chaos” Ratio. A factory that looks pristine only when you schedule an audit is a factory that is hiding its reality. If the floor is swept and the machines are wiped down only when you arrive, but the scrap bins are overflowing and the sub-assembly areas are cluttered with half-finished components, they aren’t managing production; they are managing your perception.
- Listen for the Silence of the Maintenance Logs. When I ask to see the preventative maintenance schedule, I’m not looking for a binder that says “everything is fine.” I’m looking for the messy, unplanned repair entries. If their logs are too perfect, they aren’t maintaining their machines—they are running them into the ground and waiting for the day a critical component snaps during your peak season.
- Scrutinize the Sub-Tier Transparency. A struggling factory often loses control of its own supply chain. If they can’t tell you exactly where their raw materials are coming from, or if they start “suggesting” alternative components because their usual supplier is “short,” they are likely masking a cash flow issue or a failure to secure their own inputs.
- Track the “Ghost Capacity” in the Lead Time. If a supplier quotes you a standard lead time but can’t explain how that time is partitioned between material procurement, production, and QC, they are quoting you a wish, not a schedule. Real capacity is visible in the workflow; ghost capacity is just a way to get the purchase order signed before the excuses start.
- Look for the “Quality-to-Rework” Disconnect. If their reported yield is near 100% but you notice a high volume of “rework” happening in a separate, unmonitored corner of the floor, the factory is struggling. High rework rates are a silent killer of margins and lead times; a factory that hides its scrap is a factory that will eventually ship you a container of defects to meet a deadline.
The Hard Truths: What Your Audit Data Is Actually Telling You
If a factory’s output is dropping while their “efficiency” reports remain suspiciously flat, they aren’t optimizing; they are hiding equipment downtime and running machines past their service intervals to meet your deadline.
High turnover isn’t just an HR metric; it is a direct precursor to a quality crisis, because you cannot maintain consistent tolerances when the person running the machine today hasn’t been there long enough to know what a “good” part looks like.
Stop looking at the unit price as a fixed cost and start looking at it as a variable risk; a low quote from a struggling facility is simply a loan you’ll eventually pay back through expedited freight, rework, or total order cancellation.
The Cost of Ignoring the Warning Signs

At the end of the day, spotting a struggling factory isn’t about catching them in a lie; it’s about recognizing the patterns of decay before they hit your balance sheet. Whether it is the tell-tale signs of declining throughput, the chaos of high staff turnover, or the sudden, unexplained “maintenance windows” that eat into your lead time, these aren’t isolated incidents. They are symptoms of a systemic failure to manage capacity. If you ignore the red flags on the factory floor today, you are simply choosing to pay for them later through unplanned rework, expedited freight, and broken promises to your own customers.
My advice? Stop treating your supplier’s word as a substitute for their data. A supplier who becomes defensive when you ask for maintenance logs or turnover statistics is a supplier who is already drowning. True partnership is built on transparency, not optimistic spreadsheets. Use what you’ve learned to build a procurement strategy that prioritizes evidence over enthusiasm. It might feel like you are being difficult, but in this industry, being “difficult” is often just another word for being prepared. Don’t wait for the shipment to fail to realize the factory was already in trouble; trust the floor, not the quote.